CHAPTER THREE
DATABSES II
3.4.1.3. Creating graphs- bar chart
To create charts employ the following strategies:
Step 1
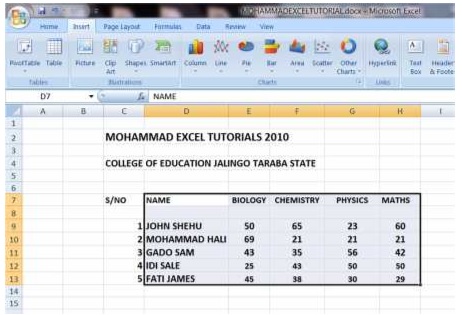
Select the cells that contain the data you want to use in the chart.
Step 2
Click the Insert tab on the Ribbon
Step 3Click the bar chart menu.
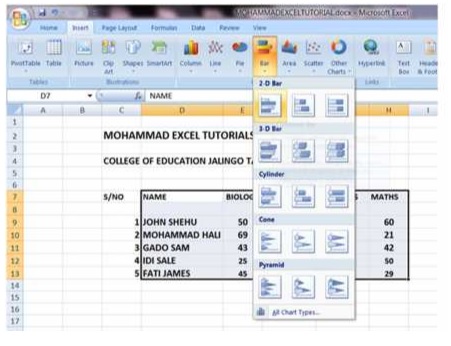
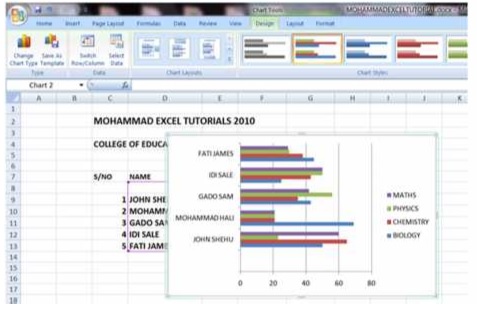
If you click on Bar Tap the Bar chart below will appear on your desktop.
| Click to page 33 | Page34 | Click to page 35 |