CHAPTER THREE
DATABSES II
Step 4
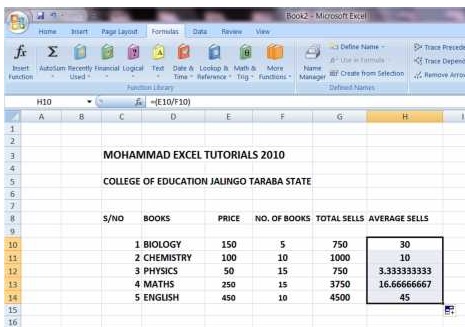
You can get the results for the remaining subjects- chemistry, physics, maths and English by placing clicking and holding the result cell. Then drag your mouse down, towards English. After reaching English, release your mouse button. You will have the picture below on your desk top.
3.4. GRAPHS
You can use Excel to create different types of charts such as:
- Column
- Line
- Pie
- Bar
3.4.1. CREATING GRAPHS - COLUMN CHARTS
To create charts employ the following strategies:
Step 1
Select the cells that contain the data you want to use in the chart.
| Click to page 29 | Page30 | Click to page 31 |

